A blog for weather enthusiasts: Parameters to analyse before giving advisories on Indian weather
Recently, there has been an increase in the number of weather enthusiasts who are putting out blogs and tweets for social cause, primarily with an intention of helping the locals as well as the farming community. India has a rich equatorial dynamics, which is extremely hard to comprehend and hence weather enthusiasts (in groups and individual) are making an effort to disseminate weather related advisories to the society.
I myself found that my passion lies in weather analysis (which is also a part of my academic research), and I should put my knowledge to use in an effective manner. With this intention, I started blogging and tweeting posts about weather conditions (both on national and regional scale). The main motive of this blog is to share my experience, as to how I go about reading the models and charts before giving out advisories.
There are five parameters that I look at, which I call “Five Point Analysis (FiPA)”. They are as follows:
(a) 850 mb Geopotential height, vorticity, and wind.
(b) 500 mb Geopotential height, vorticity, and wind.
(c) 700-400 mb relative humidity
(d) 355 K potential vorticity (PV) anomaly
(e) 200 mb-850 mb level wind shear
Apart from this, I also look at the mean sea level pressure (MSLP). In my experience, the forecasted pressure (MSLP) has a lot of uncertainty associated with it, compared to the five parameters listed above, and hence is not a very reliable parameter. But nevertheless, it is important to look at MSLP to get an idea of Low (L) and high (H) pressure zones, which affects the wind movement. I have noticed that, a very well developed L or H region (e.g. depression, cyclone, tropical storms etc.) is well forecasted, but other pressure zones are not very well forecasted. Hence, cyclone formation and its trajectory are better predicted compared to local extreme rainfall events.
Let me explain the five parameters in detail:
(a) 850 mb Geopotential height, vorticity, and wind.
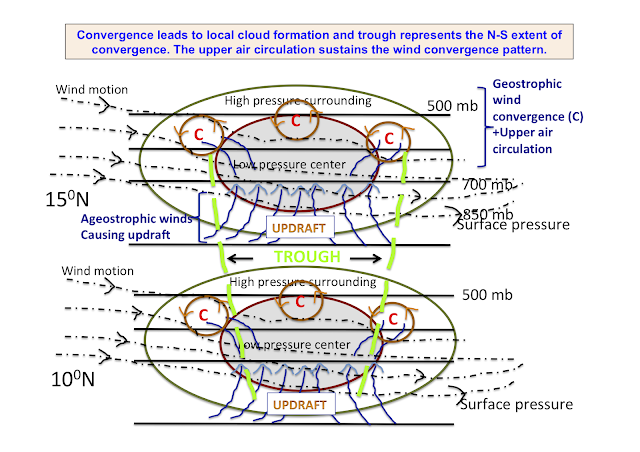
The 850 mb chart is an extremely crucial one, since it demarcates the lower atmosphere from the upper atmosphere. The dynamics of lower atmosphere are, what scientists call, in a state of “ageostrophy”. The upper atmosphere is a state of “geostrophy”, where the pressure plays an important role. Depending on the geostrophic conditions, convergence may occur, which leads to formation of clouds.
In simple terms, favourable geostrophy is the wind movement is anti-clockwise, which leads to convergence. In case of favourable geostrophy, the ageostrophy will provide the necessary “updraft”. The opposite happens for “downdraft”. As we all know, updraft leads to cloud formation. So we need to look for anti-clockwise winds in the 850 mb charts.
In the 850 mb chart, I look for convergence, the intensity of vorticity (high values indicates excellent convergence) and the wind speeds (gust vs normal winds). High winds from the sea help in bringing the moisture to land.
The Geopotential height (GPH) also gives information about the “trough” formation. A trough is a low-pressure region surrounded by high pressure. Typically, a trough is away associated with good convergence and rainfall. Therefore, 850 mb chart is used for getting the basic information about the convergence and the trough formation.
(b) 500 mb Geopotential height, vorticity, and wind
500 mb level is the mid atmosphere (~ 5 km above ground – troposphere is at 10 km above ground, which makes 500 mb the mid point).
The GPH at 500 mb level gives a lot of information about the upper atmospheric stability. The geopotential height of the 500 hPa pressure surface shows approximately how far one has to go up in the atmosphere before the pressure drops to 500 millibars. The contours show the main tropospheric waves that "control" our weather - low heights indicate troughs and cyclones in the middle troposphere while high heights indicate ridges and anticyclones. The dipping of 500 mb GPH contour lines mean that higher (usually cold) level air has come down, thereby inducing an instability in the lower atmosphere. This could trigger intensification of clouds (from cumulus to cumulonimbus).
(c) 700-400 mb relative humidity
This represents the amount of moisture present in the upper level. The 700 mb level usually corresponds to the cloud base. High moisture between 700 mb-400 mb level indicates extremely wet clouds and hence is an indicator of good rainfall.
This represents the amount of moisture present in the upper level. The 700 mb level usually corresponds to the cloud base. High moisture between 700 mb-400 mb level indicates extremely wet clouds and hence is an indicator of good rainfall.
(d) 355 K potential vorticity (PV) anomaly
The potential vorticity (PV) is another important upper level parameter. The 355K PV anomaly exists at the cusp of troposphere and stratosphere. It takes +ve and -ve values. In short, +ve values indicate instability in the upper level, which could trigger tropical wave formation that affects the lower level dynamics. The –ve value is opposite. Therefore, I am on the lookout for +ve PV anomalies.
The potential vorticity (PV) is another important upper level parameter. The 355K PV anomaly exists at the cusp of troposphere and stratosphere. It takes +ve and -ve values. In short, +ve values indicate instability in the upper level, which could trigger tropical wave formation that affects the lower level dynamics. The –ve value is opposite. Therefore, I am on the lookout for +ve PV anomalies.
(e) 200 mb-850 mb level wind shear
The vertical wind shear is an important component that determines the development of clouds, storms, and cyclones. Usually a low shear value aids in intensification and is desirable for inclement weather conditions. Hhigh levels of shear between 850mb and 200mb hinder the growth of, or weaken, tropical systems, and can also impede their genesis.
The vertical wind shear is an important component that determines the development of clouds, storms, and cyclones. Usually a low shear value aids in intensification and is desirable for inclement weather conditions. Hhigh levels of shear between 850mb and 200mb hinder the growth of, or weaken, tropical systems, and can also impede their genesis.
The “Five Point Analysis” helps me in getting a decent understanding of the upcoming weather dynamics and based on this I give out advisories. Most of the times, the FiPA gives a good forecast of the upcoming weather, and is extremely useful in predicting the dynamics of synoptic scale events, such as monsoon, ElNino etc. Localized events such as thunderstorms are hard to predict, since their genesis and degeneration happen very quickly (within a matter of few hours). The models have a good sensitivity in prediction events that has longer time-scales.
I will revise this blog by adding some graphs and figures as and when time permits, which will clearly show some of my analysis. If you find it useful, please drop a comment.
Adding a figure explaining the wind convergence, upper air circulation, and trough formation. This is the basic physics of cloud formation. The trough represents the latitudinal extent of the convergence pattern. The 700-400 mb level humidity gives us the moisture content in the clouds that are formed due to convergence. Wind shear helps in estimating the residence time of cloud bands. From, this figure, you will realise that the 850 mb, 700 mb, 500 mb wind patterns, GPH, and vorticity are the important parameters that govern the development of a weather system.
(Note: Will keep on revising this blog as and when I realise that new figures could be added to better explain the modus operandi of weather analysis).
Sources that I use for FiPA:
(a) Tropical Tid Bits
(b) Meteologix
(c) Windy.com
Disclaimer: The content given here are all personal views and the author will not be held responsible or held liable for any oversight or misinterpretation.


Comments
Post a Comment